Activity categorisation
Visualisation
February 2021
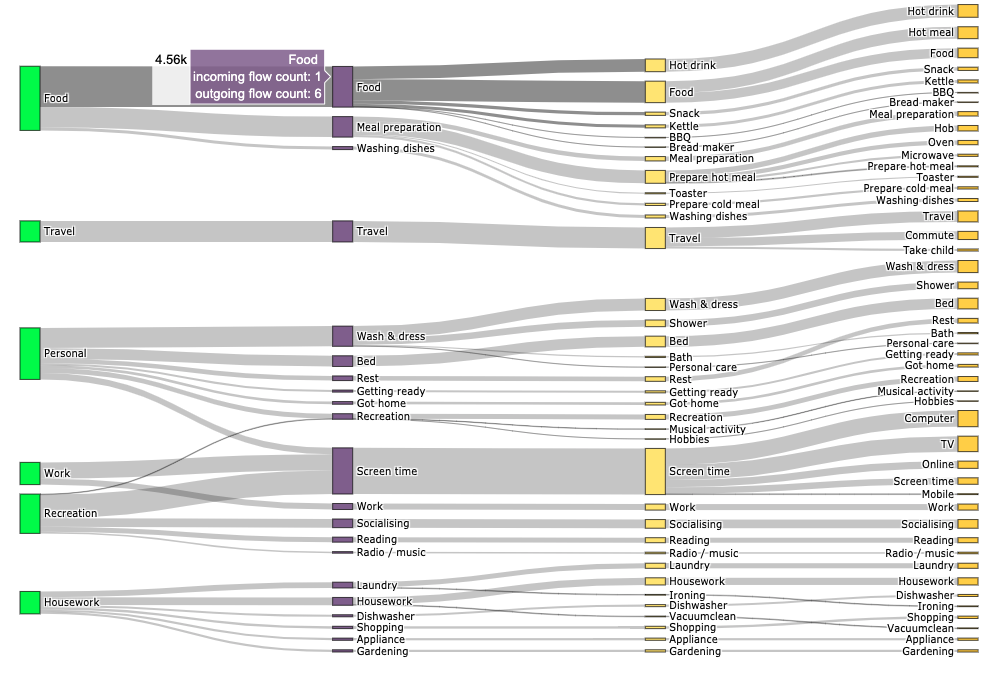
Participants can report over 200 different activities. Here is a Sankey diagram to show how we categorise activities into larger and smaller subgroups.
Participants can report over 200 different activities. Here is a Sankey diagram to show how we categorise activities into larger and smaller subgroups.
